

Non-Penalty Expected Goals (NPxG) in the 2024/25 Football Season: A Comprehensive Analysis

In modern football, metrics like expected goals (xG) and allowed expected goals (xGA) have revolutionized how we analyze team performance. These statistics quantify a team’s attacking and defensive effectiveness, providing a deeper understanding of their strengths and weaknesses. Below, we explore team performances across Europe’s top leagues after 20 rounds of the 2024/25 season, focusing on key insights derived from xG and xGA charts.
Quadrants of Performance
Our analysis divided teams into four quadrants:
Leaders: Teams that create a lot of chances while conceding very few.
Exciting Teams: High-action teams that both create and concede numerous opportunities.
Boring Teams: Below-average in both creating and conceding chances.
Struggling Teams: Teams that perform poorly in both metrics.

Key Insights from the EPL:
Liverpool: The deserved leader with the league’s best attack (by a significant margin) and second-best defense. They were at the forefront of the “Leader” quadrant but saw their xGA rise slightly after the match against Manchester United.
Arsenal: Boasts the league’s strongest defense but ranks only seventh in attack.
Nottingham Forest: Forest’s second-place standing is primarily due to their defense (1.02 xGA, behind only Arsenal and Liverpool) and a touch of luck. They rank 15th in xG, with a positive xG difference of just +0.17 compared to Arsenal’s +0.81 and Liverpool’s +1.24.
Manchester City: Despite ongoing challenges, City remains in the “Leader” quadrant, though closer to Newcastle and Bournemouth than to Liverpool or Arsenal.
Rookie Teams: All three newly promoted sides are firmly entrenched in the “Struggling” quadrant and the relegation zone, showcasing the challenges of adapting to the Premier League’s intensity.
Tottenham Hotspur: Spurs stand alone in the “Exciting” quadrant, with high-scoring and high-conceding matches under Ange Postecoglou.
Manchester United: Positioned in a cluster with Brighton (performing slightly better) and Crystal Palace (performing slightly worse), United’s placement in the lower half of the table is reflective of their inconsistent form.
Serie A: The League of Defense
Italy’s Serie A is notable for its defensive focus. Interestingly, it is the only top-five league without a single team averaging over 2.0 NPxG and has just two teams exceeding 1.5 xG.

Key Insights from Serie A:
Inter and Atalanta: Lead the league in xG and rank third and fourth in xGA, respectively.
Juventus and Napoli: Share the title of the league’s best defenses but sit only in the top six for attack. Their xG (1.3) is underwhelming, with Juventus and Napoli trailing Inter’s xG by nearly 0.4 per match.
Cagliari: The league’s “Exciting” outlier, ranking eighth in xG but 18th in xGA.
Como: Positioned near Fiorentina and Bologna in xG and xGA, Como’s underlying stats suggest potential for a strong second half of the season if they regress to the mean.
Bottom Teams: Venezia, Lecce, Verona, and Parma occupy the bottom quadrant. Parma’s defensive issues are especially pronounced, allowing 0.26 more xGA per game than the 19th-placed team.
Bundesliga: A Hotbed of Excitement
Germany’s Bundesliga lives up to its reputation as one of the most thrilling leagues in Europe, featuring multiple teams in the “Exciting” quadrant.

Key Insights from the Bundesliga:
Bayern Munich: Dominates the league with the best xG (2.05) and xGA (0.54). Their defensive superiority is nearly twice as strong as the second-best defense (Bayer Leverkusen’s 1.0 xGA).
Bayer Leverkusen: Despite less luck than last season, Leverkusen remains in the “Leader” quadrant with the third-best attack and second-best defense.
Union Berlin: The league’s sole representative in the “Boring” quadrant, emphasizing a conservative approach to games.
Exciting Teams: Four teams populate the “Exciting” quadrant, with several others on the verge of joining, reinforcing the Bundesliga’s reputation for high-octane football.
La Liga and Ligue 1: The Dominance of Giants
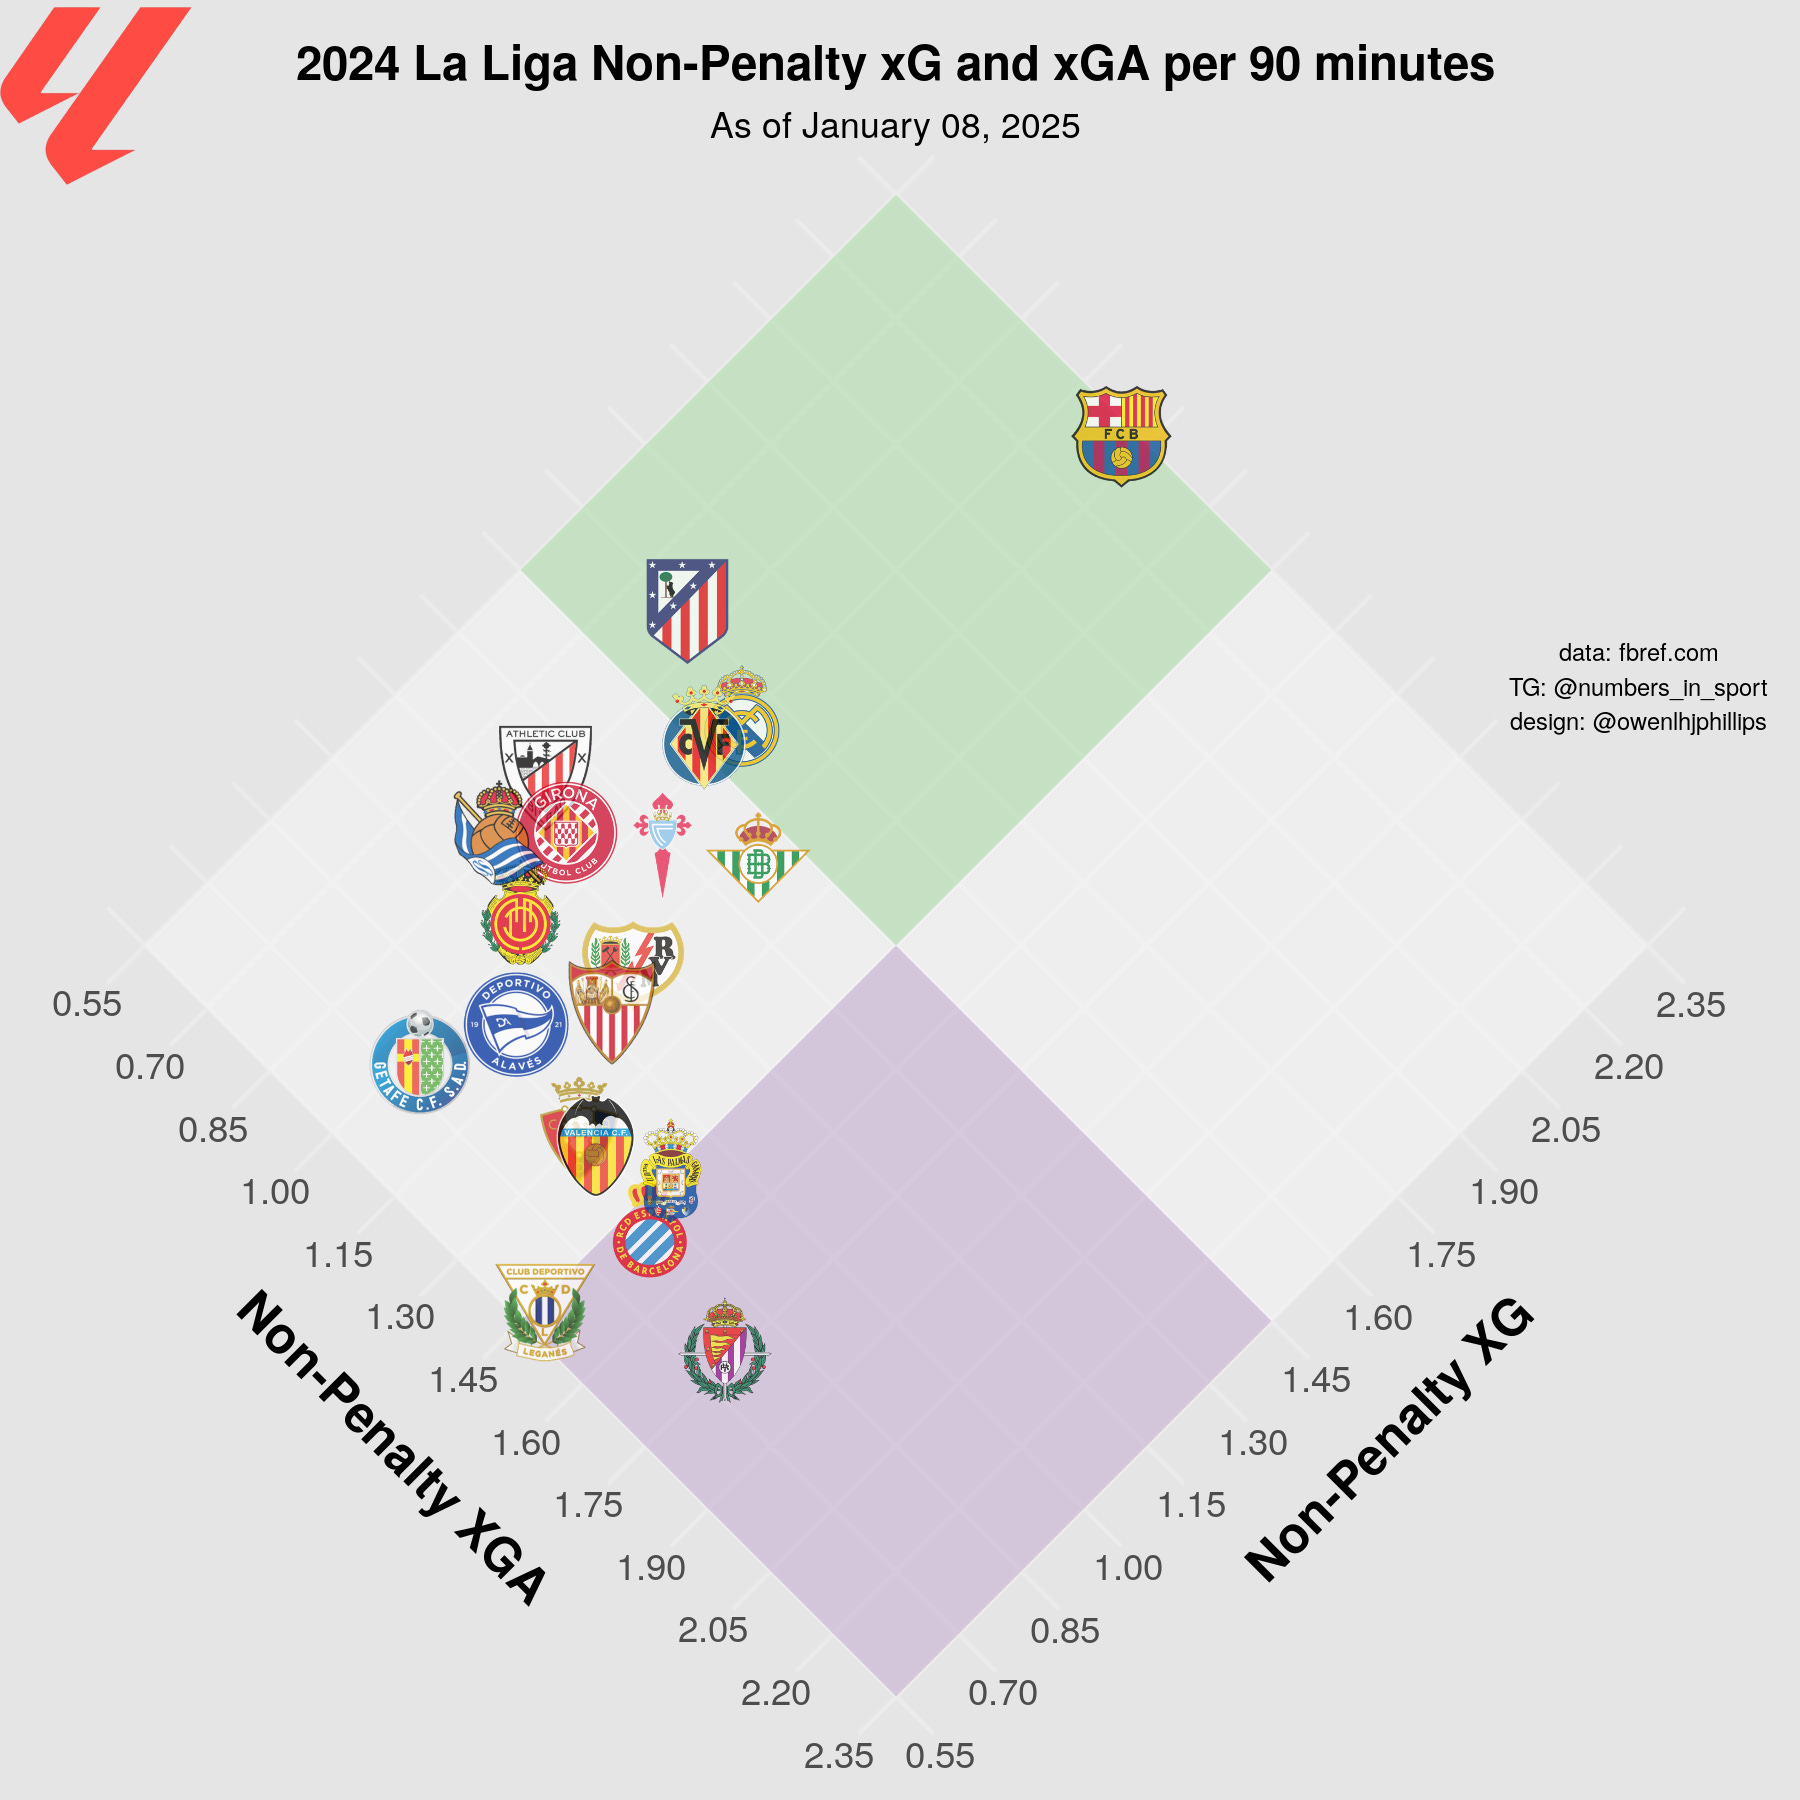
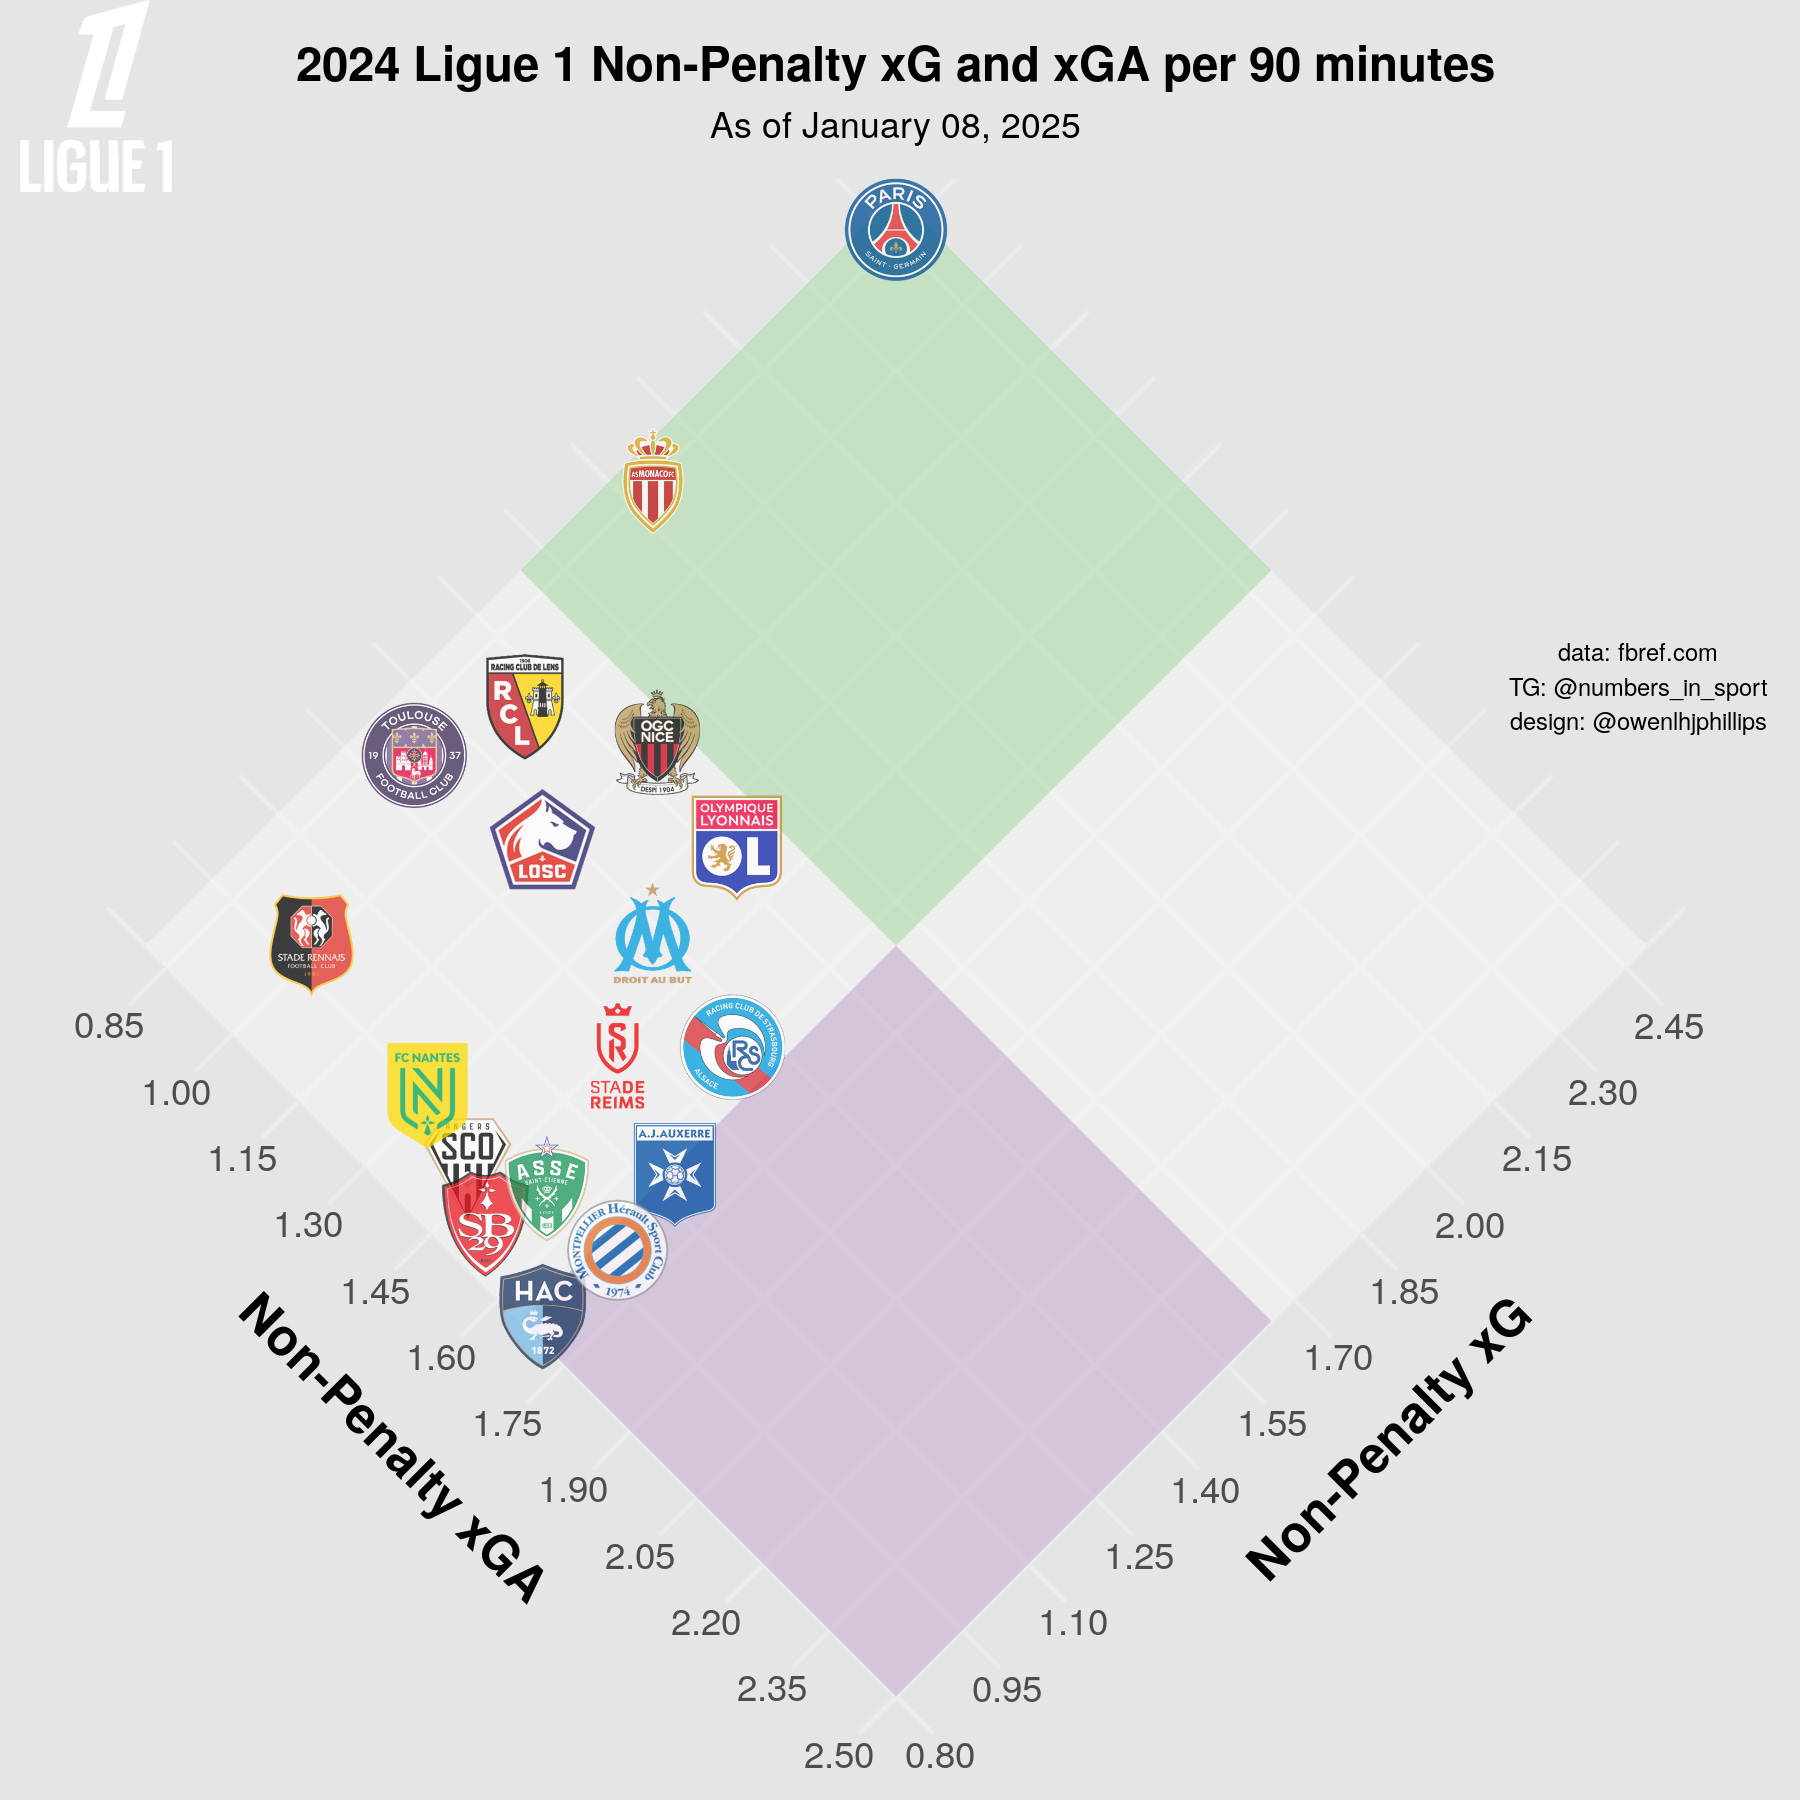
In Spain and France, dominant performances from Barcelona and PSG skew the charts, creating a notable disparity between top teams and the rest of the league.
Key Insights from La Liga and Ligue 1:
Barcelona (La Liga): Leads the league with 2.33 xG, far outpacing second-place Atletico Madrid (1.6 xG).
PSG (Ligue 1): Tops both xG (2.46) and xGA (0.85). The gap between PSG and Monaco in attack (0.56 xG) highlights their overwhelming dominance.
Marseille: Despite solid results, their underlying numbers suggest overperformance, raising questions about sustainability.
Conclusion
By visualizing team performances across quadrants, we gain a clearer picture of strengths, weaknesses, and trends shaping Europe’s top leagues.
It would be interesting to see charts for the five leagues with the same scale used for the metrics.